Trending Twitter Hash Tags
Requirements
Read raw twitter data from Bronze lake
Extract all hash tags in a new column
Store the hash tags in Postgresql DB table
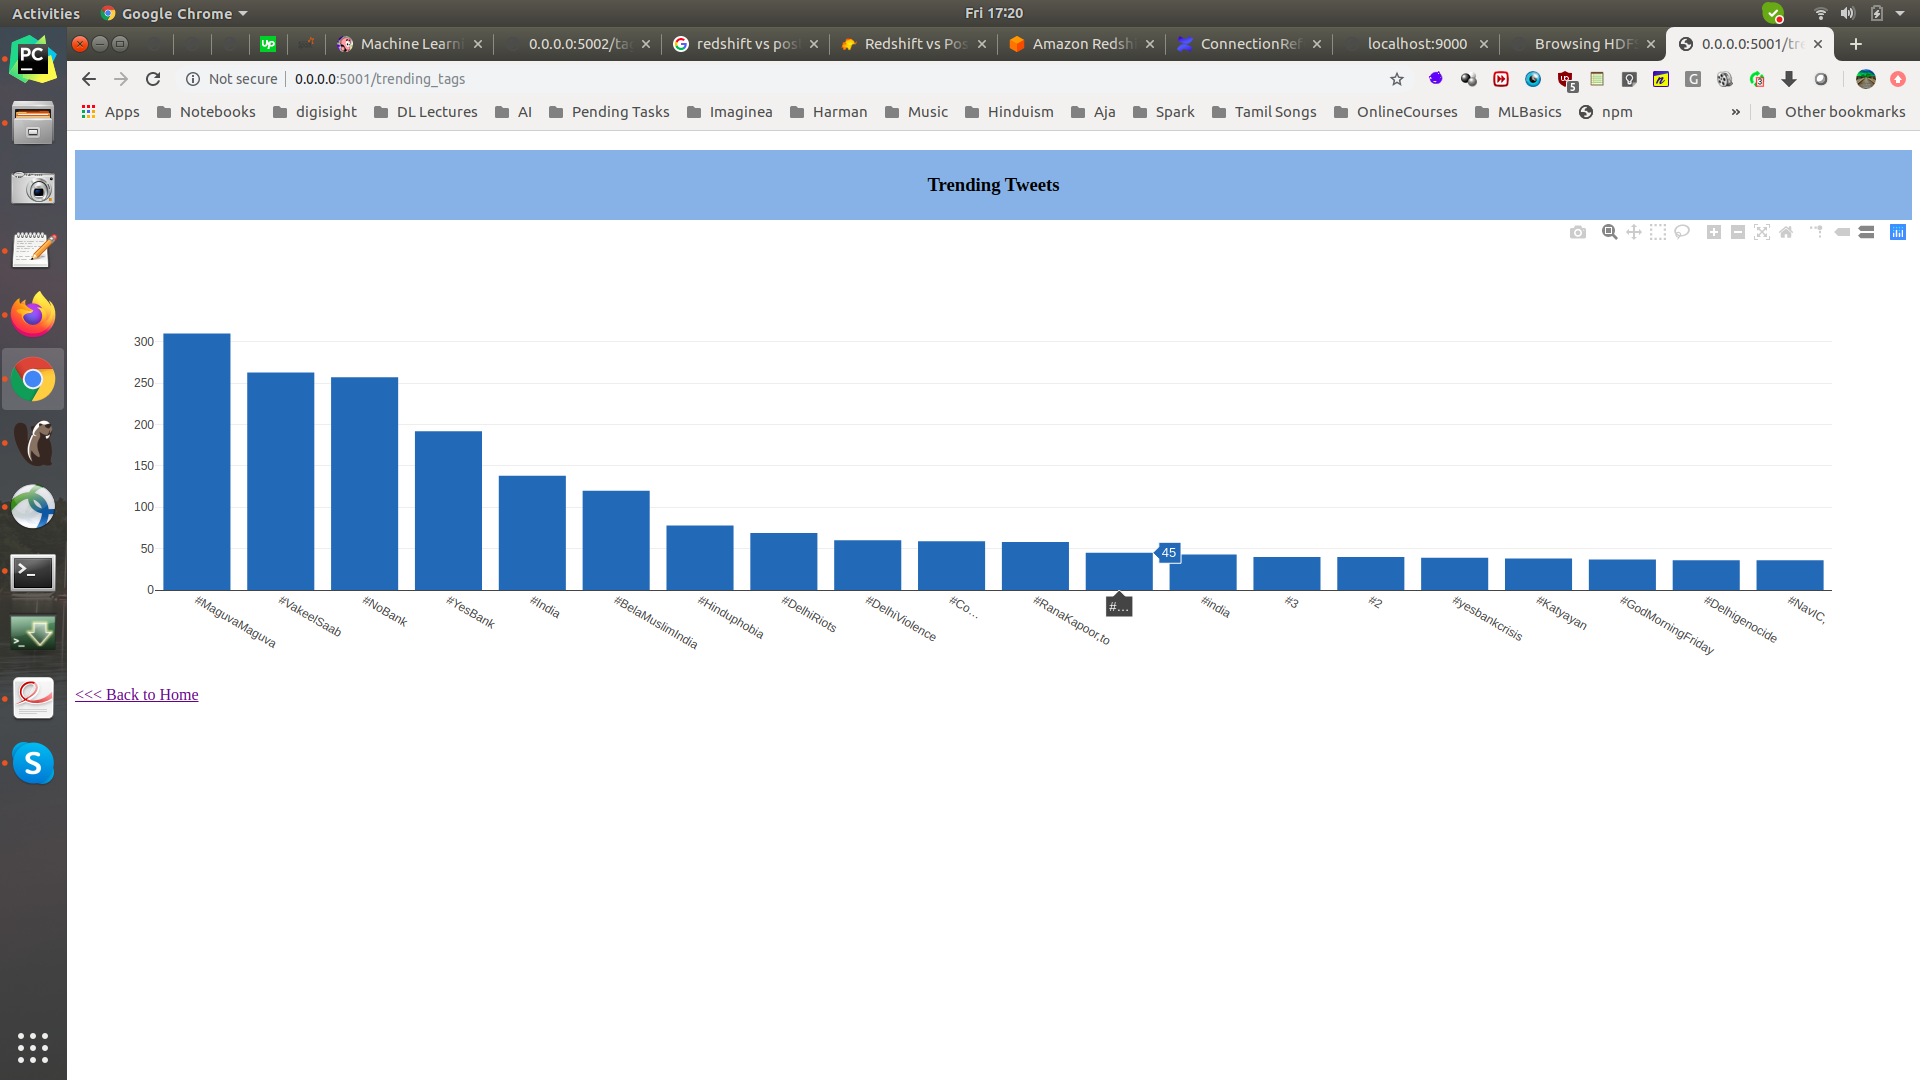
Design a simple naive dash board with Bar charts for trending tweets
Implementation
Read the Bronze lake parquet raw data into Spark Structured input stream
Create a new column with
UDFto extract the hash tags and useexplodeon array of hash tags to create new row for each hashtagWith
foreachParitionAPI, dump the data into Postgresql DB tableIn Flask backend read the data from Postgresql DB table
Use plotly to create Bar chart and display it on the HTML page
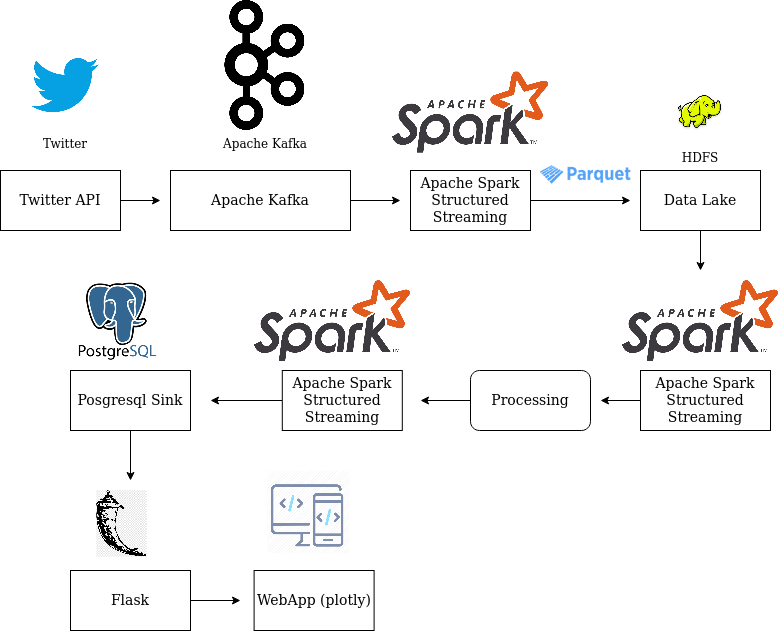
Below is the data flow path:
Bronze Lake/Live Stream ---> Spark Structured Streaming Parquet Source ---> Extract Hash Tags with UDF --
                                    -> Spark Structured Streaming Postgresql Sink

Postgresql ---> Flask REST API ---> Web Application
Configuration
How to run?
There are two ways of running, that is on docker or on your local machine. In either case, opening the terminal is the difference, once the terminal is launched, the steps are common.
Start the docker container, if needed:
docker run -v $(pwd):/host/ --hostname=$(hostname) -p 50075:50075 -p 50070:50070 -p 8020:8020 -p 2181:2181 -p 9870:9870 -p 9000:9000 -p 8088:8088 -p 10000:10000 -p 7077:7077 -p 10001:10001 -p 8080:8080 -p 9092:9092 -it sparkstructuredstreaming-pg:latest
To get a new terminal for our docker instance run : docker exec -it $(docker ps | grep sparkstructuredstreaming-pg | cut -d' ' -f1) bash
Note: We pull our container run id with $(docker ps | grep sparkstructuredstreaming-pg | cut -d' ' -f1)
This example needs multiple terminals:
Producer bin/data/start_kafka_producer.sh
Twitter API -> Kafka Producer -> Kafka Serversrc/ssp/spark/streaming/consumer/twiteer_stream_consumer_main.py
Hashtag bin/trending_tweet_hashtags.sh
Bronze Lake ---> Spark Structured Streaming Parquet Source ---> Extract Hash Tags with UDF ---> Spark Structured Streaming Postgresql Sink
Dashboard bin/flask/trending_hashtags_dashboard.sh
Postgresql ---> Flask REST API ---> Web Application
On each terminal move to source folder
If it is on on local machine
#
cd /path/to/spark-streaming-playground/
If you wanted to run on Docker, then ‘spark-streaming-playground’ is mounted as a volume at
/host/
docker exec -it $(docker ps | grep sparkstructuredstreaming-pg | cut -d' ' -f1) bash
cd /host
[producer] <- Guake terminal name!
export PYTHONPATH=$(pwd)/src/:$PYTHONPATH
vim bin/data/start_kafka_producer.sh
bin/data/start_kafka_producer.sh
[hashtag]
export PYTHONPATH=$(pwd)/src/:$PYTHONPATH
vim bin/analytics/trending_tweet_hashtags.sh
bin/analytics/trending_tweet_hashtags.sh
[dashboard]
export PYTHONPATH=$(pwd)/src/:$PYTHONPATH
vim bin/flask/trending_hashtags_dashboard.sh
bin/flask/trending_hashtags_dashboard.sh
Head to http://0.0.0.0:5001/ for live count on the trending #hashtags
Take Aways / Learning’s
Covers the previous use case learnings
How to use the Flask and Python to read the data from Postgres and create a bar chart on a naive dashboard
References For people who are looking for more advanced dashboard can refer these links: